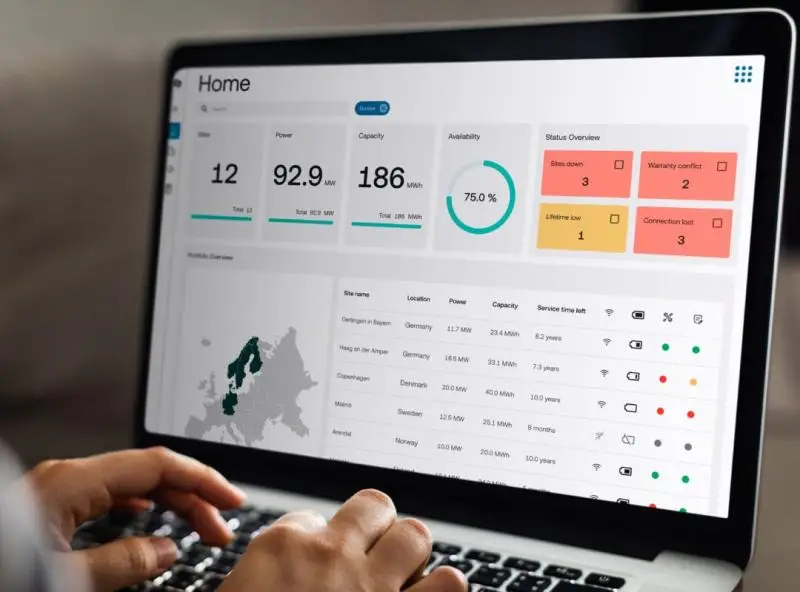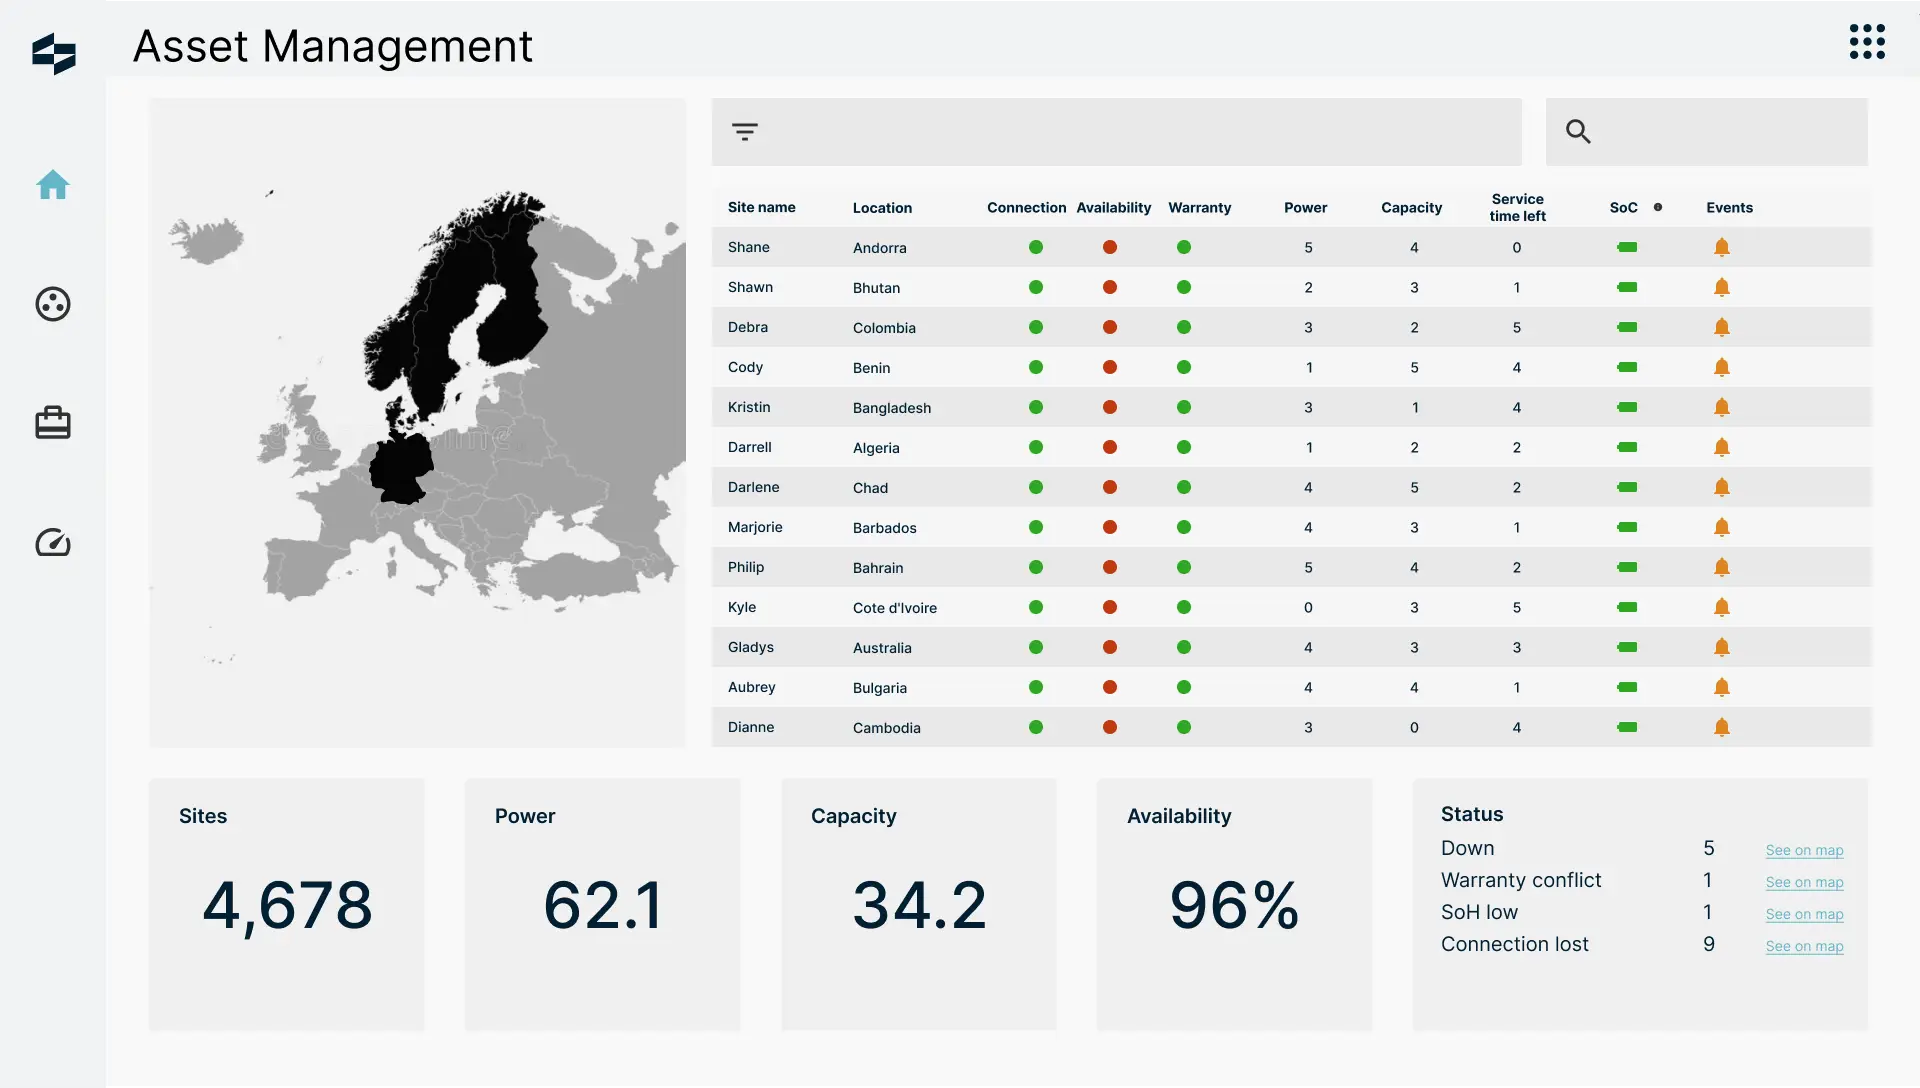
Data shown is fictional. Real client data and some screens are omitted due to NDA restrictions.
Context
Batteries, business owners and the grid
Cellect needed an intuitive app to monitor energy storage performance and act on it with simple, clear actions.
The users. Business owners running large batteries in stores or community buildings, who want to cut costs by drawing from the grid off-peak.
The goal. Categorize the content, define the app architecture and design the interactions for dashboards and creation flows.
01 · Deliverable
Research into an unfamiliar industry
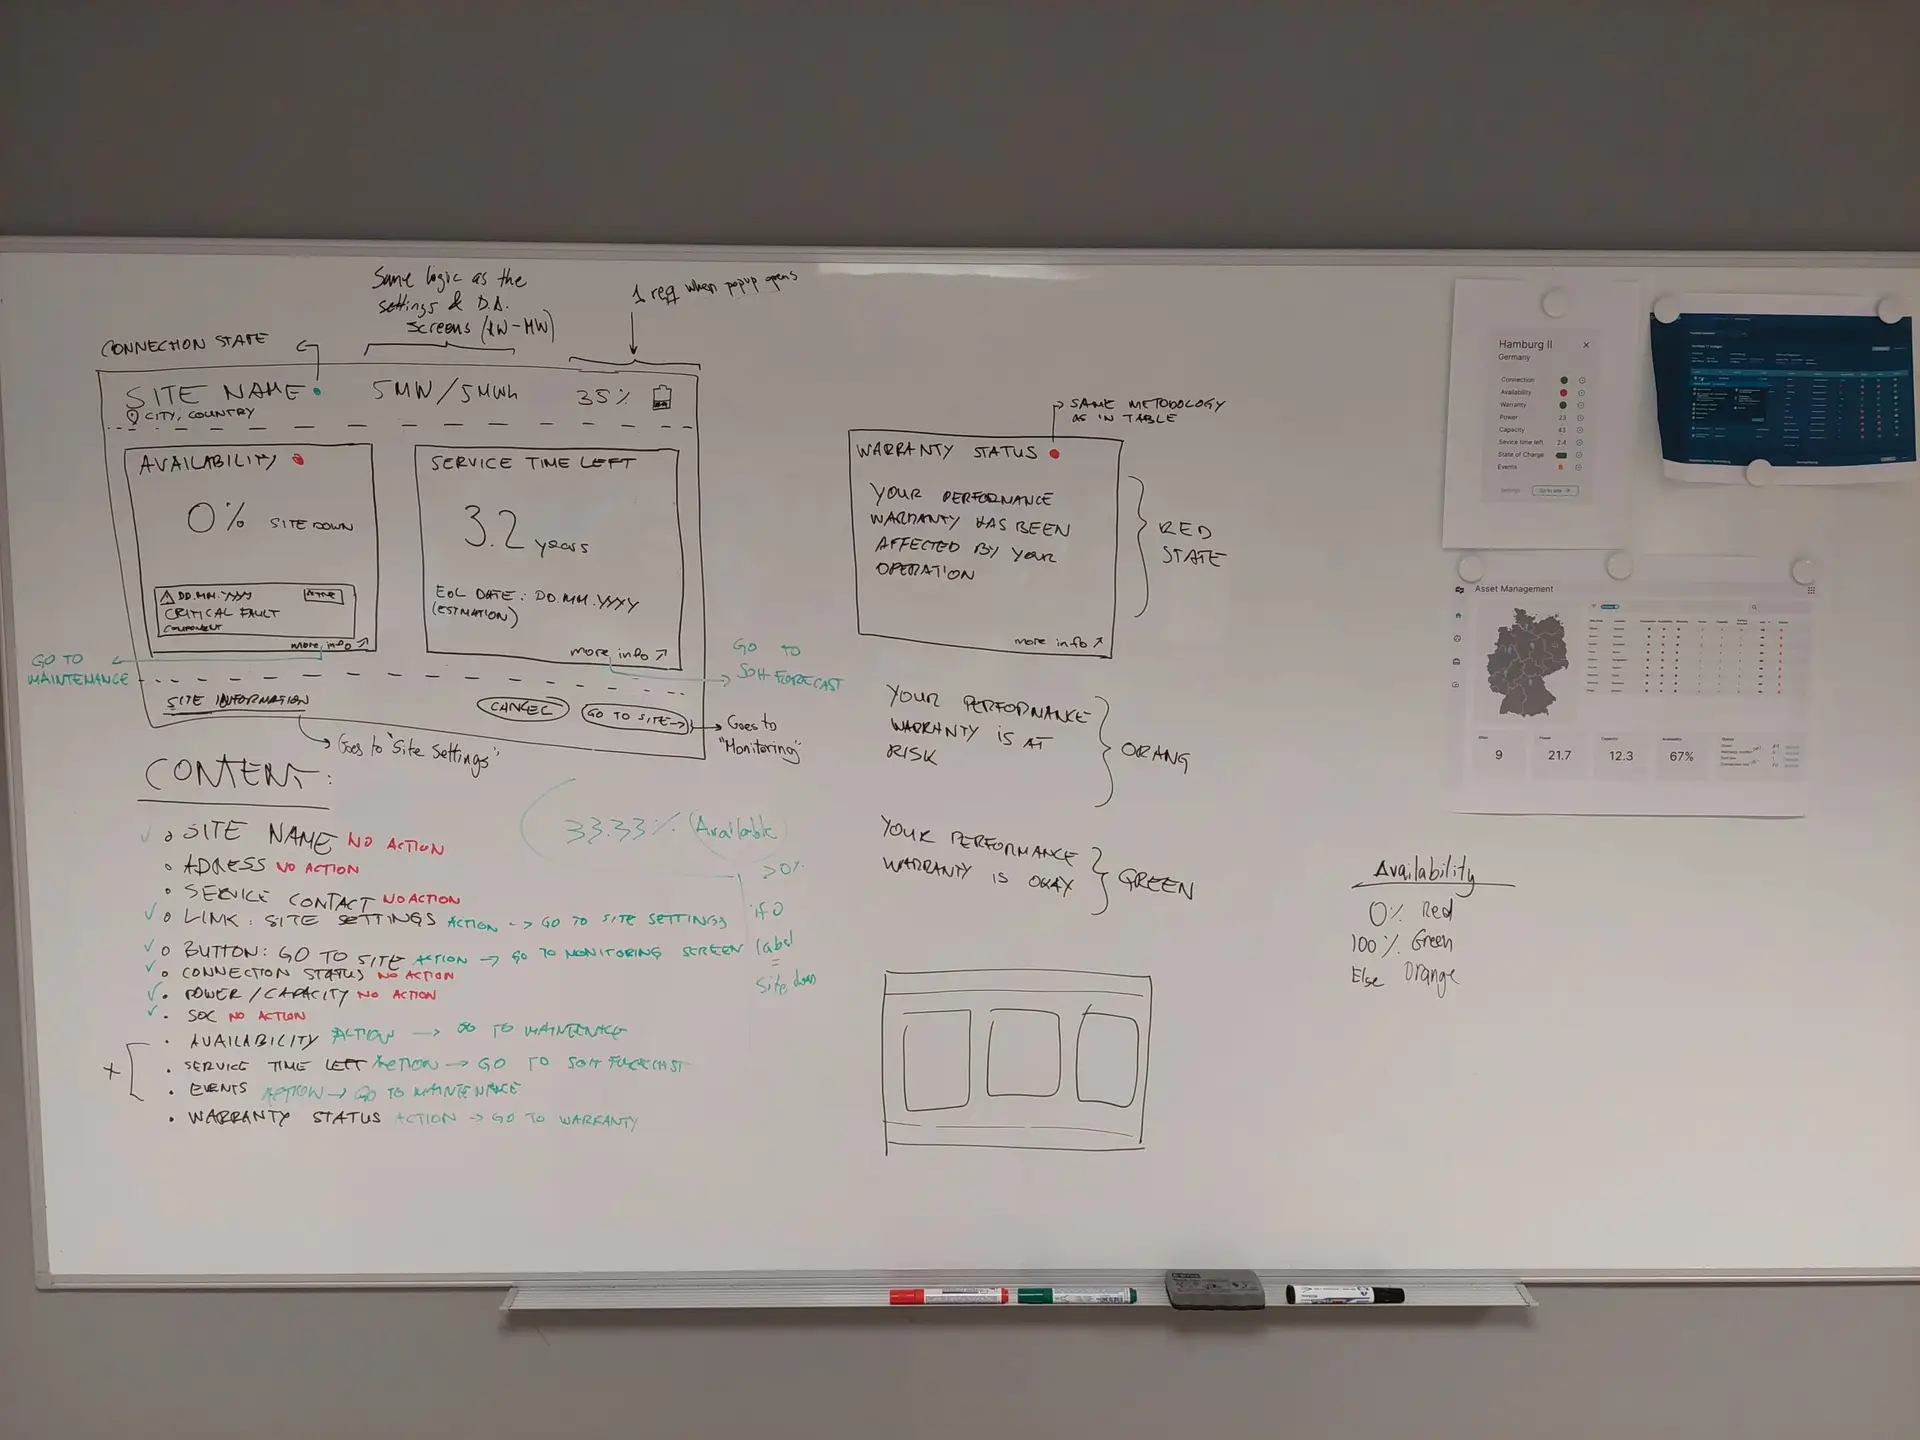
I analyzed Cellect's internal documentation, ran competitor analysis across direct rivals and adjacent industries, and interviewed key stakeholders.
What we learned: users preferred simple performance dashboards over action-heavy interfaces, desktop was still their main device, and clear KPIs were essential.
02 · Deliverable
App architecture and prototype
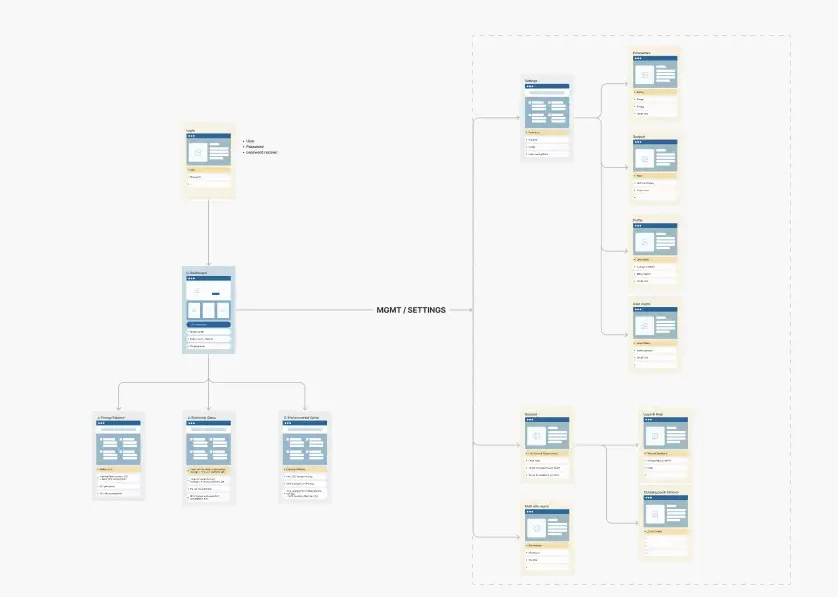
I defined the content categories and navigation structure, then moved to wireframes and a fully interactive prototype.
The structure works across desktop and mobile, so monitoring feels the same wherever users check their sites.
03 · Deliverable
Data visualization that people trust
I designed the dashboards, graphs and statistics, iterating with stakeholders until each KPI was represented accurately.
When the development approach needed a decision outside my expertise, I brought in a specialist and combined their input with my MVP experience.
Result: Cellect planned its app from scratch in record time.